

Generative engine optimization is the practice of changing content so that AI answers cite it, and the measured effects are far smaller and far more conditional than the marketing suggests.
The number everyone quotes, a 40% visibility lift, comes from one table in one 2024 paper. The same table shows the same technique cutting visibility by 30% for a different page. This article goes through what the studies actually measured, which techniques survived replication in 2025 and 2026, and what correlates with citations on live platforms rather than in a benchmark.
Where the 40% number comes from
Aggarwal and colleagues at Princeton and IIT Delhi published GEO: Generative Engine Optimization at ACM KDD 2024 (arXiv:2311.09735). They built GEO-bench, 10,000 queries across 25 domains, split into 8,000 training, 1,000 validation and 1,000 test queries, then tested nine content edits against a generative engine that used Google's top five results as context.
Two things about that setup decide how you should read every number that followed.
First, they did not measure "did the page get cited". They measured Position-Adjusted Word Count, how much of the answer text is attributed to a source weighted by citation position, and Subjective Impression, a model scored blend of relevance, influence and click likelihood.
Second, the headline figures are aggregates. Best methods improved Position-Adjusted Word Count by up to 41% and Subjective Impression by up to 28%. Cite Sources, Quotation Addition and Statistics Addition produced 30% to 40% relative improvement on the first metric. Authoritative tone produced no significant improvement. Keyword stuffing was often worse than doing nothing.
| Technique | What it does | Reported effect |
|---|---|---|
| Cite Sources | Add citations to credible sources | 30% to 40% on position adjusted visibility |
| Quotation Addition | Add credible quotations | 30% to 40% |
| Statistics Addition | Replace qualitative claims with numbers | 30% to 40% |
| Fluency Optimization | Improve readability | 15% to 30%, inconsistent |
| Easy to Understand | Simplify language | 15% to 30%, inconsistent |
| Authoritative | More confident tone | no significant improvement |
| Technical Terms, Unique Words | Add jargon or unusual vocabulary | no reliable improvement |
| Keyword Stuffing | Repeat the query terms | at or below baseline, about 10% worse in the Perplexity test |
The table nobody quotes
The same paper breaks those lifts down by the page's original Google rank. This is where the useful part is.
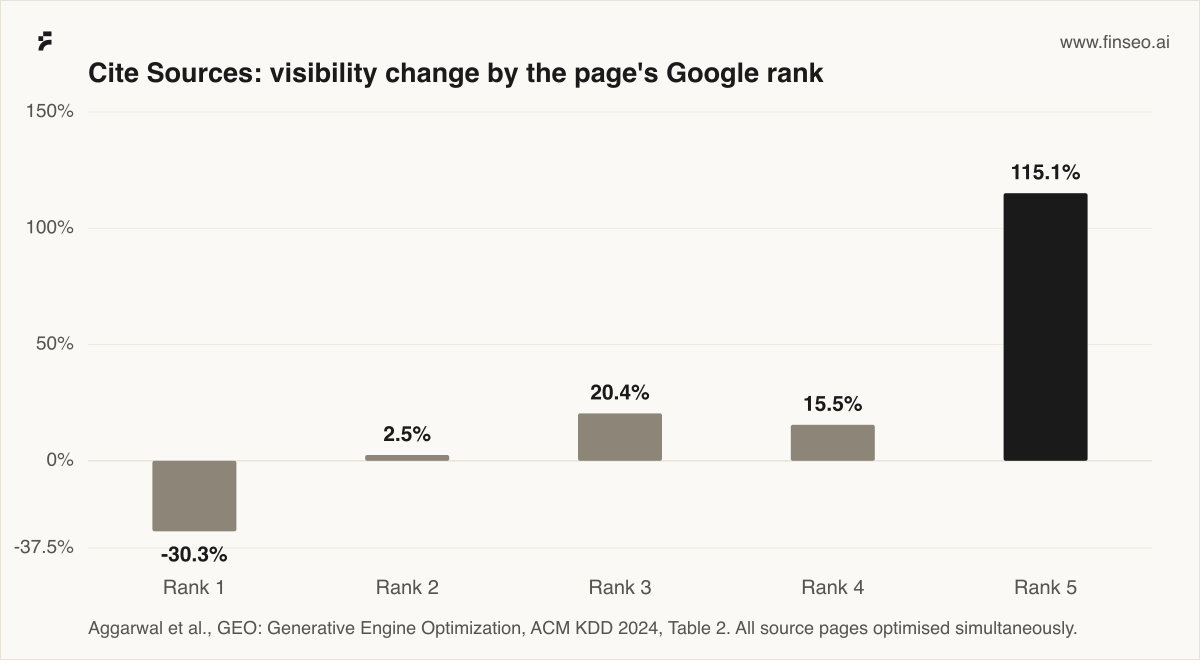
Adding citations lifted a rank five page by 115.1% and cut the rank one page by 30.3%. Quotation Addition and Statistics Addition follow the same shape: roughly +100% and +98% at rank five, roughly −23% and −21% at rank one.
Read carefully, this is a redistribution effect. When every candidate page is optimised at once, the answer has a fixed amount of attention to give, and the pages that gain are the ones that were weakest. It is not evidence that adding citations always increases your chance of being cited. If you already sit at rank one, the same edit may cost you.
The combination test points the same way. On a 200 example subset, the best pair, Fluency Optimization plus Statistics Addition, beat the best single technique by only 5.5%. Cite Sources averaged 31.4% when combined with other methods. Small subset, modest gains, no compounding miracle.
The deployed test on Perplexity is the closest thing to a live result in the paper: Quotation Addition scored about +22% on position adjusted visibility and +30% on impression, Statistics Addition about +9% and +37%. Those are impression scores on uploaded sources, not measured increases in how often real pages get cited.
What replication found in 2025 and 2026
Four follow up studies matter, and they do not all agree.
FeatGEO (Liu and Xu, Nanjing University of Information Science and Technology, arXiv 2026) is the most direct challenge. Testing token level heuristics across GPT-4o-mini, Gemini 2.5 Flash and Qwen-plus, the Princeton style edits did not consistently beat baseline. On GPT-4o-mini, baseline visibility was 13.34% while token level methods landed between 10.92% and 12.21%. On Gemini the gap was worse: baseline 8.89%, methods 4.62% to 5.62%. Their own feature level approach reached 18.31% on GPT-4o-mini, so content optimisation works. Sprinkling quotations and statistics into text does not reliably transfer across engines.
AgentGEO (Tian et al., Virginia Tech and Zhejiang University, arXiv 2026) diagnosed why pages were not cited, from 949 uncited versus cited document pairs, then repaired them. It achieved more than 40% relative improvement in citation rate while changing about 5% of the content. The failure taxonomy is the part worth pinning to a wall:
| Why pages are not cited | Share of diagnosed failures |
|---|---|
| Semantic alignment with the query | 62.2% |
| Content quality | 27.1% |
| Technical integrity | 10.1% |
| Systemic exclusion | 0.6% |
Nearly two thirds of citation failures are a page answering a different question than the one being asked. No amount of statistics fixes that.
GEO-SFE (Yu et al., University of Tokyo and collaborators, arXiv 2026) tested structure across 200 articles, 377 queries and six generative engines, 2,400 test cases. Citation rate went from 45.0% to 52.8%, a 17.3% relative improvement, p below 0.001, Cohen's d of 0.64. Macro structure, meaning how the document as a whole is organised, contributed 44.9% of the gain. Micro structure contributed 15.4%.
Competitive GEO (Vishwakarma et al., Sprinklr, ACM SIGIR 2026) ran 252,000 pairwise trials across six LLM systems, injecting exactly two candidate sources that differed in one factor at a time. Four factors were significant across every system with odds ratios above 100: topic match, an explicit price, a recent timestamp, and being in position one. Structured versus dense formatting was weak and inconsistent, odds ratios between 0.78 and 1.68.
Note what that last line does to a common piece of advice. Bullet points and tables did not decide citation in a controlled test. Topical fit, freshness and specificity did.
What we see across 8.9 million answers
Benchmarks use simulated engines. Before the published studies, here is what our own tracking shows, because it is the largest live sample we can speak to directly: 8.94 million analysed AI answers and 8.85 million cited sources, of which 4.2 million answers across 11 models in the last 90 days alone.
Engines differ more in how many sources they cite than in anything else. Across 731,000 answers in a 14 day window:
| Engine | Answers | Avg. citations | Median | Answers with any citation |
|---|---|---|---|---|
| Perplexity | 140,334 | 13.69 | 10 | 100.0% |
| Google AI Mode | 49,292 | 12.95 | 11 | 94.6% |
| AI Overviews | 219,495 | 8.73 | 8 | 96.2% |
| Copilot | 10,973 | 6.30 | 5 | 96.6% |
| Gemini | 65,778 | 5.24 | 4 | 82.2% |
| ChatGPT | 242,290 | 4.76 | 4 | 99.3% |
| Grok | 797 | 2.14 | 1 | 66.6% |
A Perplexity answer holds roughly three times the citation slots of a ChatGPT answer. If you are choosing where to start, that ratio matters more than any technique on this page.
And the citation pool is far less concentrated than a SERP. Ranked by citations across our full source corpus:
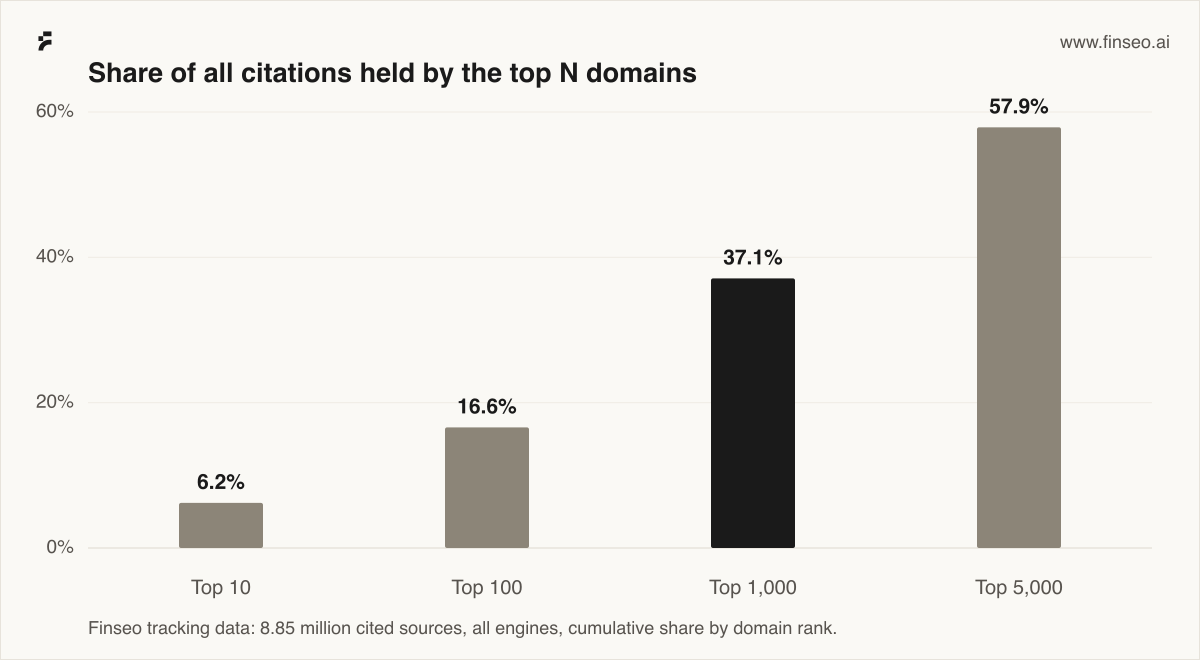
It takes 1,000 domains to account for 37.1% of citations and 5,000 to reach 57.9%. The ten most cited domains together hold 6.2%. Compare that with a classic SERP, where ten results hold everything on page one. The long tail in AI citations is not a consolation prize, it is where most of the volume is, which is the strongest argument for optimising a mid-authority site that will never outrank Wikipedia.
What the published studies add
Those numbers are ours. These are other people's, on production systems, and they answer questions our data cannot.
AirOps, 2026, analysed 15,000 prompts and 548,534 retrieved pages, and measured the step we cannot see: only 15% of retrieved pages made it into the answer. Retrieval is not citation, and most GEO advice is aimed at the wrong stage.
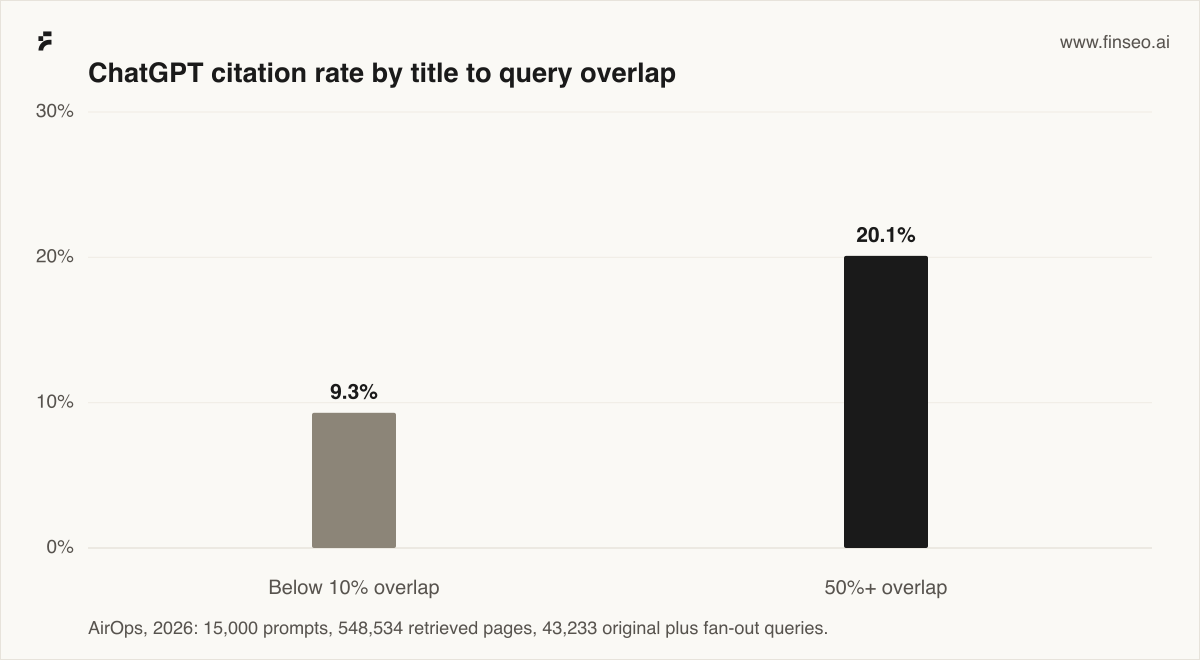
More from the same dataset:
- Pages ranking first in Google were cited 3.5 times more often than pages outside the top 20, and 43.2% of position one pages were cited.
- 32.9% of cited pages that ranked in Google's top 20 appeared only for a fan-out query, not for the original prompt, which is the mechanism behind query fan-out.
- 95% of fan-out queries had zero traditional monthly search volume.
- Domain authority was not monotonic: sites in the DA 20 to 80 band supplied 63.6% of citations, while DA 80 to 100 supplied 25.4% with a lower post retrieval citation rate than most middle tiers.
Ahrefs, 2026, across 1.4 million prompts, measured title similarity of 0.602 for cited titles against 0.484 for non cited ones, and 0.656 for fan-out query to cited title. Natural language URL slugs were cited 89.78% of the time against 81.11% for non natural slugs.
Kevin Indig's Growth Memo, 2026, analysed 1.2 million AI answers and 18,012 verified citations: 44.2% of citations came from the first 30% of the page, cited text carried 20.6% proper nouns against roughly 5% to 8% in ordinary English, and cited content averaged a Flesch-Kincaid grade of 16 against 19.1 for lower performing content.
Two practical implications fall straight out. Put the answer in the first third of the page, and name entities explicitly instead of writing "the company" and "the tool".
What about schema?
Schema markup is strongly correlated with pages that get cited, which is why every checklist demands it, and it is one of the checks in an AI content optimization pass. The strongest causal test in this evidence set found no positive citation lift from adding JSON-LD to pages that were already heavily cited.
Both things can be true. Sites that ship clean structured data tend to be the sites that also ship clean information architecture, fast pages and accurate entities. Schema is a symptom of that discipline more than a cause of citations. Ship it, because retrieval eligibility depends on machines parsing your page, and stop expecting it to move the needle on its own.
Why the same technique helps one page and hurts another
The rank stratified table is not a quirk of the benchmark. It follows from how the answer is assembled.
A generative engine retrieves a handful of candidates, then decides how much of the answer each one earns. That budget is finite. When every candidate improves at once, the ones with the most room to gain take share from the ones that already had it. The rank one page was already the default source. Making the rank five page quotable gives the model a reason to spread attribution.
Two consequences for planning.
If you are the incumbent, defend differently. Adding more statistics to a page that already wins the answer is not the lever. Keeping it current, keeping the entities explicit and keeping it aligned to the question is. Sprinklr's recency odds ratios, from 14.4 to above 10,000, say freshness is the strongest single defensive move available.
If you are the challenger, evidence density is the cheapest attack. The techniques with the largest measured gains for low ranked pages are exactly the ones that cost a writing afternoon: cite the sources you already rely on, quote the people you already talked to, replace adjectives with numbers.
And for both: the AgentGEO taxonomy says 62.2% of citation failures are semantic alignment. Before any of this, check that the page answers the question it is competing for. That is not a GEO technique, it is the precondition.
A defensible checklist
Ordered by the strength of the evidence behind each item, not by how often it appears in listicles.
| Do this | Evidence | Strength |
|---|---|---|
| Answer the exact question the page targets, in the first third | AgentGEO: 62.2% of failures are semantic alignment; Growth Memo: 44.2% of citations from the first 30% | Strong |
| Match title to the queries people actually ask, including fan-out phrasings | AirOps: 20.1% vs 9.3% citation rate; Ahrefs: 0.602 vs 0.484 similarity | Strong |
| Keep the page current and show the date | Sprinklr: recency odds ratios from 14.4 to above 10,000 | Strong |
| Be specific: prices, specifications, named entities | Sprinklr: specifications 8.63 to 243; Growth Memo: 20.6% proper nouns | Strong |
| Organise the document as a whole around the topic | GEO-SFE: macro structure is 44.9% of the structural gain | Moderate |
| Add statistics, quotations and cited sources | Princeton: 30% to 40% aggregate, but rank dependent; FeatGEO: inconsistent across engines | Moderate, conditional |
| Rank well in classic search | AirOps: position one cited 3.5× more often | Strong, indirect |
| Ship structured data | Correlated with cited pages, no measured causal lift | Weak as a lever, still required plumbing |
| Stuff keywords, add jargon, sound authoritative | Princeton: at or below baseline | Do not |
How to test this on your own pages
Every number above comes from someone else's sample. The only sample that matters for your decisions is yours, and running the test takes three things.
- A fixed prompt set. Twenty to fifty prompts per topic, held constant, run on a schedule. Changing the prompts between runs makes the comparison meaningless.
- A baseline period. Two to four weeks before any edit, so you know your normal variance. In our tracking, answer sets change often enough that a single before and after comparison is close to worthless.
- One change at a time, on some pages and not others. A holdout group is what separates a result from a coincidence.
None of it is worth much if you cannot value the outcome, which is what AI search attribution covers. That is what AI visibility tracking is for: the same prompts, every day, across ChatGPT, Perplexity, Claude, Gemini, Google AI Mode, Copilot, Grok, Mistral and DeepSeek, with the cited sources recorded per answer so you can see whether your edit changed the citation set or just your mood. Pair it with AI citation tracking to see which third party pages the models lean on for your category, and with competitor analysis in AI search to see who currently holds the share you want, because on the AirOps numbers those middle authority domains are where most citations actually come from.
Method note
Our own figures come from Finseo tracking data, aggregated across accounts with no customer, project or private domain identifiable in any number. The engine comparison covers a 14 day window and states the answer count per engine, which is what makes Grok's 797 answers readable as the thin sample it is. The concentration figures cover the full source corpus. Prompt sets are chosen by our customers, so the corpus skews toward the categories they sell in; it is a large sample, not a random one, and any claim about "AI search in general" should be read with that in mind.
Every external figure is attributed to its study, with sample size and year. The Princeton figures are from the published paper and its Table 2. The 2025 and 2026 replications are arXiv preprints or conference papers, and several use simulated retrieval rather than production endpoints, which we flag inline rather than in a footnote. The live platform figures come from vendor and publisher analyses, which are large but not peer reviewed.
Each primary source was checked before quoting. Where studies disagree, both are shown. Finseo did not run these experiments; where we say something about our own data, it is labelled as ours.
FAQ
Does generative engine optimization actually work? Content changes measurably shift citation behaviour in controlled tests, with citation rates moving from 45.0% to 52.8% in GEO-SFE and by more than 40% relative in AgentGEO. The 40% figure attached to the Princeton paper is a benchmark aggregate, not a promise for a specific page.
Is GEO different from SEO? It overlaps heavily. Ranking first in Google made a page 3.5 times more likely to be cited by ChatGPT in the AirOps data, so classic search performance remains one of the strongest inputs. What is new is optimising for questions with no search volume and for retrieval rather than clicks.
Should I add statistics and quotes to every page? Add them where they belong. The evidence for that technique is real but conditional on rank and inconsistent across engines. Fixing what question the page answers beats decorating a page that answers the wrong one.
Does schema markup get me cited? It is correlated with cited pages and had no measured causal lift in the strongest test available. Ship it for parsing and eligibility, not as a citation lever.
How long until changes show up in answers? Longer than a rank change and with more noise. Run a fixed prompt set with a baseline period, because answer sets move on their own.
Which pages should I optimise first? The ones already retrieved but not cited. On the AirOps data 85% of retrieved pages never make the answer, which is the largest and cheapest pool of upside you have.
Finseo runs your prompt set daily across nine answer engines and records every cited source, so you can test these techniques on your own pages instead of trusting a benchmark. See how AI visibility tracking works.
Sources
Ours
- Finseo tracking data: 8.94 million analysed AI answers and 8.85 million cited sources
- Finseo tracking data: citations per answer by engine, 731,000 answers in a 14 day window
- Finseo tracking data: citation concentration by domain across the full source corpus
External
- Aggarwal et al., GEO: Generative Engine Optimization, ACM KDD 2024 — https://arxiv.org/abs/2311.09735
- Tian et al., Diagnosing and Repairing Citation Failures in Generative Engine Optimization (AgentGEO), arXiv 2026
- Yu et al., Structural Feature Engineering for Generative Engine Optimization (GEO-SFE), arXiv 2026
- Liu and Xu, Think Before Writing: Feature-Level Multi-Objective Optimization for Generative Citation Visibility (FeatGEO), arXiv 2026
- Vishwakarma et al., What Gets Cited: Competitive GEO in AI Answer Engines, Sprinklr, ACM SIGIR 2026
- Wu et al., What Generative Search Engines Like and How to Optimize Web Content Cooperatively (AutoGEO), Carnegie Mellon University, arXiv 2025
- AirOps (2026), 15,000 prompts and 548,534 retrieved pages
- Ahrefs (2026), 1.4 million prompt analysis
- Kevin Indig, Growth Memo (2026), 1.2 million AI answers and 18,012 verified citations
Google Search
Save Finseo as a preferred source to see our articles more often in Top Stories, AI Overviews and AI Mode.