
AI search attribution ties visits, signups and revenue back to the AI answers that produced them, including the ones your analytics files as direct.
That last part is the whole problem. Someone asks ChatGPT which tool to use, reads the answer, and types your domain into their browser two days later. Every click based system you own records a direct visit. The answer that made the decision leaves no trace at all. This article puts a measured number on that gap, shows how to close most of it with a post purchase survey joined to GA4, and turns the result into a revenue figure you can defend in front of a board.
How big is the AI attribution gap?
Four datasets put a number on it. They differ in size and method, and they agree on the direction.
The workflow automation company n8n compared its GA4 last touch data against a post conversion survey. GA4 attributed roughly 1% of conversions to AI search. The survey attributed roughly 9%, a tenfold gap. The reason, in Graphite's write up of the study: 90% of AI sourced conversions never click a citation link at all.
| Source | Sample | Click based | Self reported | Gap |
|---|---|---|---|---|
| n8n, via Graphite (2026) | one company, GA4 vs. post conversion survey | ~1% of conversions | ~9% of conversions | ~10× |
| Fairing (2026) | 158 ecommerce brands, 104 weeks, Nov 2024 to May 2026 | UTM plus AI referrer | survey attribution | 7.5× more AI orders, 10.6× more AI revenue |
| Omniscient Digital (2026) | own pipeline, first touch vs. survey | 15% of AI sourced leads | 50% to 70% | ~4× |
| Refine Labs, dark social | 620 conversions, $21.5M revenue | 90% of influence unrecorded |
Fairing's is the largest of the four and the most carefully hedged. It extrapolates survey responses to non respondents, so 7.5× and 10.6× are estimates of hidden influence rather than observed sessions. That is the correct way to read every number in this table, including ours.
What our own survey data shows
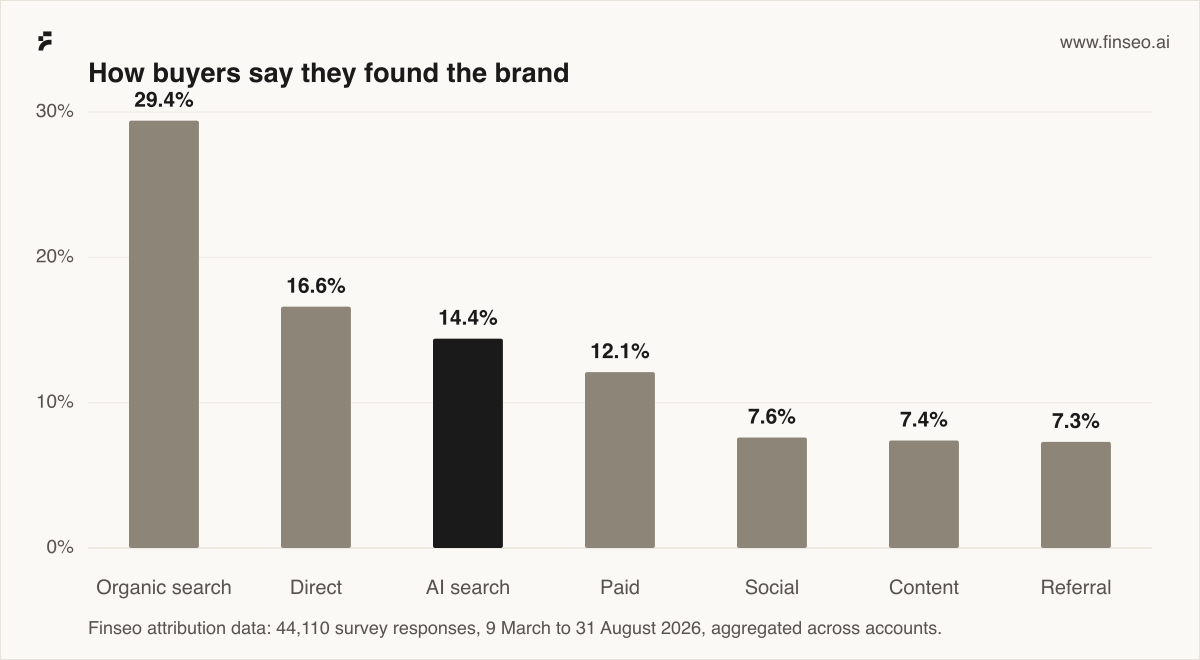
Finseo runs the survey side of this as a product, so we can check the pattern on our own numbers rather than on someone else's. Across 44,110 attribution survey responses collected between 9 March and 31 August 2026, AI search is the third most named discovery channel.
Two things in that data matter more than the share itself.
AI search carries more value than its share suggests. Those 6,366 responses account for €1,798,215 of €11,014,860 in reported deal value, which is 16.3% of the value against 14.4% of the responses. Average reported value per AI-named response is €310 against €265 for every other channel, about 17% higher.
Analytics does not see it. Only 472 of those responses carry an analytics source we can compare against. On that subset, 35 people named an AI assistant and analytics recorded 2. Analytics filed 177 of them as organic search and 46 as direct. The sample is small enough that the ratio should be read as an order of magnitude rather than a precise multiple, and it points the same way as every study above.
The mechanism behind all of it is the same. Assistants answer, users act later. Profound's analysis of 700,000 ChatGPT conversations found only about 18% trigger a web search at all. Most of the influence never becomes a click, so it never becomes a row in your analytics.
What your analytics actually records
AI referral traffic is real, measurable and small.
The largest study on the click side is Kaiser and Schulze in Marketing Science (INFORMS, 2026): 973 ecommerce sites, over 50,000 ChatGPT referred transactions against 164 million transactions from traditional channels, August 2024 to July 2025, summarised by Search Engine Land. Organic LLM traffic came to under 0.2% of visits, roughly 200 times smaller than Google organic, with ChatGPT accounting for over 90% of it. Regression adjusted, organic search had a 13% higher conversion likelihood than LLM traffic, and revenue per session worked out at about $1.49 for LLM versus $1.82 for organic search.
Conductor's 2026 report, across 1,215 enterprise domains and 3.3 billion sessions, puts AI referrals at 1.08% of all traffic. The number is higher than the ecommerce studies because the industry mix is different, and the spread inside it matters more than the average.
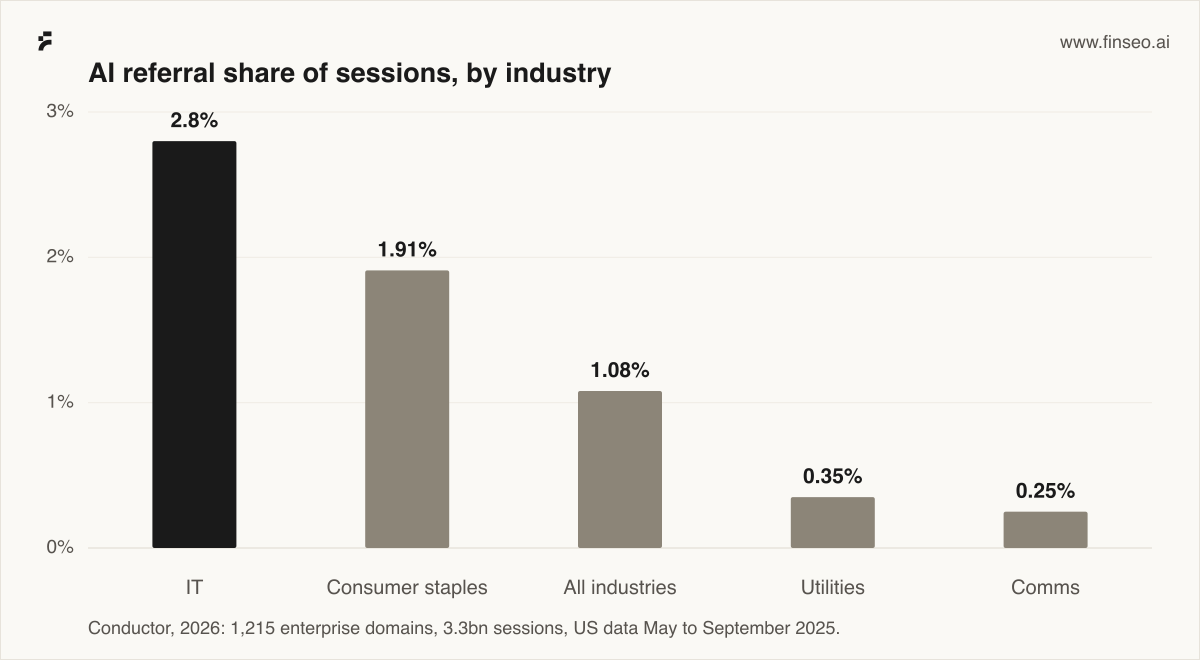
87.4% of those AI referrals came from ChatGPT. For most brands, one assistant currently is the channel, which makes the tracking question simpler than the vendor landscape suggests.
Contentsquare's 2026 Digital Experience Benchmark, built on 99 billion sessions across 6,500 sites, lands in the same band: AI referred traffic at 0.2% of total visits, growing 632% year over year, converting at 1.3% against 1.9% for email.
Does AI traffic convert better? The evidence disagrees with itself
This is where most articles pick the number that suits them. Here is the spread, with sample sizes attached, because sample size is what separates these results.
| Study (year) | Sample | AI conversion vs. organic |
|---|---|---|
| Kaiser and Schulze, Marketing Science (2026) | 973 ecommerce sites, 50k+ ChatGPT transactions | organic 13% higher than LLM |
| Amsive (2025) | 54 sites | LLM 4.87% vs. organic 4.60%, not significant (p=0.794) |
| Siege Media (2026) | 78 sites, GA4, Jan to May 2026 | median 1.26× in AI's favour (finance 1.67×, ecommerce 1.01×) |
| ThoughtMetric (2025) | 100 ecommerce stores | ChatGPT 6.7% vs. Google 3.9%, about 1.72× |
| Seer Interactive (2025) | one client | ChatGPT 15.9% vs. organic 1.76%, on 0.07% of traffic |
| Contentsquare (2026 benchmark) | 99bn sessions, 6,500 sites | AI 1.3%, email 1.9% |
Do not average these. The two largest samples say AI converts at parity or slightly worse. The eye catching multiples come from small or single site samples where AI traffic is a fraction of a percent and self selects for high intent. Anyone quoting "AI converts 5× better" as a category fact is quoting a case study.
The strategic point survives either way. The clicked portion of AI search is a rounding error whose conversion advantage is unproven. The influenced portion is roughly ten times larger and invisible. Optimising against the visible 0.2% is optimising against the wrong number.
Why AI visits land in "direct"
The clearest measurement comes from Scrunch's 2026 opt in panel. Among news site visits that happened after an AI conversation about the news, only 1.1% carried an AI referrer. About three quarters arrived as direct navigation and about 9% through traditional search. That is a last click artefact rather than proof that AI caused 98.9% of those visits, but it shows exactly what a referral dashboard can physically see.
Four mechanisms produce it, in rough order of how much traffic each one hides.
- No click at all. The answer was enough, or the user searched your brand later in a fresh session. Nothing to attribute.
- Referrer stripped. Assistant apps and in app browsers often send no referrer, so GA4 has nothing to classify and defaults to Direct.
- Delayed action. The conversation happens on a phone at 21:00. The purchase happens on a laptop the next morning. Different device, different session, no join key.
- Branded search in between. The user hears your name in an AI answer, then searches for it. Google organic takes credit for demand the assistant created.
Only the second one is fixable in analytics configuration. The other three need a different instrument.
What to fix in GA4 first
Before adding any new tooling, make GA4 record the part it can see. Three changes, in this order.
Build a channel group for assistants. A custom channel group with a regex on the referrer hostname separates assistant traffic from Direct and from Referral. Keep the pattern in one place, because the hostnames change: chatgpt\.com|chat\.openai\.com|perplexity\.ai|gemini\.google\.com|copilot\.microsoft\.com|claude\.ai|you\.com|x\.ai.
Tag what you control. Any link you place inside an assistant surface, a plugin, an app listing or a documentation page an assistant tends to quote, gets a UTM. It is a small slice, and it is the only slice with clean provenance.
Separate bots from humans. AI crawlers hit your site far more often than AI users do. If GPTBot and friends land in the same reports as human sessions, every rate you compute will be wrong. Filter them out of behavioural reports and read them separately in AI crawler and bot traffic analytics.
None of this recovers the unclicked majority. It makes the visible minority trustworthy, which you need before comparing it with survey data.
The instrument: a post purchase survey
One question, asked after conversion, in an open text field: "How did you hear about us?"
Growth Method's guidance on self reported attribution is blunt about the format. Use an open text field, "not a dropdown", because a dropdown "tests whether the respondent knows your channel taxonomy, not what happened." Someone influenced by ChatGPT rarely picks "AI search" from a list. They type "chatgpt told me about you".
The obvious objection is that self reports are unreliable. The n8n study contains its own control for exactly that. Organic and paid search appeared in similar proportions in both GA4 and the survey. The channels that click tracking measures well matched each other. Only the AI channel diverged, which is the signature of a measurement gap rather than of unreliable respondents.
Practical rules that decide whether the data is usable:
- Open text, always optional. A required field costs conversions and buys you noise.
- Ask once, at the moment of conversion. Recall decays fast.
- Classify with a model, not a regex. Answers arrive as "the AI recommended it", "chat gpt", "gemini said you were the best for x". Bucket them into channels and keep the raw text.
- Report the response rate with every number. A 22% response rate on 900 orders is a different claim from a 22% response rate on 40.
- Watch for the recency trap. People report the last thing they remember, not always the thing that moved them. Surveys overstate the final touch just as click tracking does, in the opposite direction.
Joining survey answers to GA4 in Finseo
This is the part Finseo automates, and the reason our own attribution numbers exist. Three inputs, one output.
| Input | Where it comes from | What it contributes |
|---|---|---|
| Prompt tracking | Finseo runs your prompt set daily across ChatGPT, Perplexity, Claude, Gemini, Google AI Mode, Copilot, Grok, Mistral and DeepSeek | Whether you were visible, and cited, at the time of the order |
| Session and conversion data | GA4 integration | What analytics recorded: channel, device, timestamps, revenue |
| Post purchase survey | Finseo's post purchase integration on the thank you page | What the customer says actually happened |
| Output | Finseo attribution report | Recorded AI sessions, self reported AI discovery, and the gap between them in revenue |
The join is deliberately simple: order ID and timestamp. The survey response and the GA4 conversion meet on the order, then get classified into channels. Two numbers fall out for the same period.
- Recorded AI revenue. Orders GA4 assigned to an AI referral source.
- Self reported AI revenue. Orders where the customer named an assistant, whatever GA4 recorded.
The difference is the blind spot, expressed in currency rather than in a vague slide about AI being important. Add AI visibility tracking and a third number appears: whether the periods when your visibility rose are the periods when self reported AI discovery rose. That correlation is what turns a measurement into a plan.
Extrapolating to a revenue figure
The survey covers respondents. The business runs on all orders. To get from one to the other:
- Response rate. Responses divided by orders in the period. Below roughly 15%, treat the result as directional only.
- AI share among respondents. Orders naming an assistant divided by total responses.
- Applied share. Multiply that share by total orders in the period. This assumes respondents resemble non respondents. State the assumption whenever you present the number.
- Revenue. Multiply by the average order value of the AI naming cohort, not the site average. In our data the two differ often enough to matter.
- Net of what analytics already saw. Subtract the revenue GA4 already attributed to AI referrals, or you will double count.
A worked example with round numbers. Four thousand orders in a quarter. Nine hundred survey responses, so a 22.5% response rate. Eighty one of those name an assistant, a 9% share. Applied to 4,000 orders that is 360 AI influenced orders. At €140 average order value that is €50,400, against perhaps €5,000 that GA4 recorded as AI referrals. The hidden figure for the quarter is €45,400.
The arithmetic is trivial. The discipline is in stating the response rate, the assumption and the subtraction every single time, because the same five steps produce a defensible number or a fantasy depending on whether you show them.
A worked sanity check
Two cross checks catch most errors before a number reaches a slide.
Does a known channel match? Compute the same survey share for paid search or email, where GA4 is reliable. If survey and analytics agree there and disagree only on AI, your survey is working. If they disagree everywhere, your survey is broken.
Does the timing line up? Plot self reported AI discovery against your visibility score by week. A gap that is real tends to move with visibility. A gap that is an artefact of survey wording does not move at all.
What to do with the number
- Set the budget argument straight. A channel worth ten times what analytics shows deserves a different line in the plan, and a different level of patience. The number belongs in the same deck as everything else, which is what the AI visibility reporting is for.
- Find which answers produce revenue. Prompt level visibility joined to survey outcomes shows which questions matter commercially, not just which ones you appear in. Most of those questions never reach a keyword tool, which is what query fan-out is about.
- Watch the sources, not only the score. If a comparison site drives the answers you appear in, that site is now part of your PR and partnerships plan. Citation tracking makes it visible.
- Re run quarterly. Contentsquare's 632% year over year means any figure you quote today is stale within two quarters.
- Then work on the answers themselves. Attribution tells you the channel is worth more than it looks. What actually moves citations is a separate question, with its own evidence.
Method note
Our own figures come from Finseo attribution data: 44,110 survey responses collected between 9 March and 31 August 2026, aggregated across ecommerce and B2B accounts, excluding responses flagged as low quality. Deal values are as reported by the respondent or matched from the order, in euro. The analytics comparison uses only the 472 responses that carry an analytics source, because a survey answer without an analytics counterpart cannot be compared with one; that subset is small and we say so wherever we use it. No account, project or customer is identifiable in any figure.
Each primary source was opened and checked before quoting. Every figure carries its publisher, year and sample size, and studies that disagree are shown disagreeing rather than averaged into one comfortable number.
Limits worth stating plainly. Self reported attribution captures the discovery a customer remembers. Multi touch journeys collapse into a single answer. Low response rates make small segments unstable. None of that makes the method worse than click tracking for this channel, which misses roughly nine tenths of it.
FAQ
Does Google Analytics track AI traffic? It tracks the AI traffic that arrives with a referrer, which is a minority of AI influenced sessions. GA4 cannot see an assistant conversation that ends without a click, so those conversions land in Direct or in branded organic.
How do I see AI traffic in GA4? Build a channel group with a regex matching the assistant hostnames, then segment on it. That gives you the clicked portion, which is useful but not the whole channel.
How do I track LLM mentions rather than clicks? Run a fixed prompt set against the models on a schedule and record whether your brand appears, in what position, and with which sources cited. That is what AI visibility tracking does, and it is the only view of the unclicked majority.
Is direct traffic good or bad? Neither. A rising Direct segment alongside rising AI visibility usually means AI driven demand being misfiled, not loyalty.
How do I calculate attributed revenue from AI search? Multiply the AI share among survey respondents by total orders, then by the average order value of that cohort, then subtract what analytics already attributed. Report the response rate alongside the result.
How many survey responses do I need? Enough that one respondent cannot move the share by more than a point. At a 9% AI share, roughly 400 responses puts the margin of error near three points. Below 150 responses, report a range rather than a number.
Which assistant should I track first? ChatGPT, on the current evidence. Conductor puts 87.4% of AI referrals there, and the Marketing Science dataset puts over 90% of LLM sessions there. Track the rest, but do not split your effort evenly across nine engines that do not split traffic evenly.
Finseo runs your prompts across nine answer engines, joins the results to GA4 and to post purchase survey data, and reports the gap in revenue. See how AI search attribution works.
Sources
Ours
- Finseo attribution data: 44,110 survey responses, 9 March to 31 August 2026, channel shares and reported deal value
- Finseo attribution data: the 472 responses carrying both a survey answer and an analytics source
External
- Graphite, Last Touch Attribution Only Captures 10% of n8n's AEO Conversions (2026) — https://graphite.io/five-percent/n8n-attribution-gap
- Omniscient Digital, First Touch Attribution Captures 15% of Our AI Sourced Leads (2026) — https://beomniscient.com/blog/first-touch-vs-self-reported-attribution-aeo/
- Growth Method, Self Reported Attribution: The Best Way to Measure AI Search (2026) — https://growthmethod.com/self-reported-attribution/
- Contentsquare, 2026 Digital Experience Benchmark, 99bn sessions, 6,500 sites — https://contentsquare.com/blog/ai-referred-traffic/
- Search Engine Land on Kaiser and Schulze, Marketing Science (INFORMS, 2026), 973 ecommerce sites — https://searchengineland.com/llms-google-referral-conversion-study-463747
- Fairing (2026), post purchase survey vs. click attribution across 158 ecommerce brands
- Conductor (2026), AI referral share across 1,215 enterprise domains and 3.3bn sessions
- Scrunch (2026), opt in panel on referrer presence after AI conversations
- Siege Media (2026), Amsive (2025), ThoughtMetric (2025), Seer Interactive (2025), conversion rate comparisons
Google Search
Save Finseo as a preferred source to see our articles more often in Top Stories, AI Overviews and AI Mode.